Pso VP 2.0This indicator provides an advanced volume analysis tool that visualizes trading activity across different price levels and automatically identifies key support and resistance zones.
How It Works:
The Volume Profile analyzes historical price and volume data within a specified lookback period, distributing volume across horizontal price levels. Unlike traditional volume indicators that show volume over time, this tool displays volume at price, revealing where the most significant trading activity has occurred.
The algorithm:
Divides the price range into customizable horizontal bars (bins)
Calculates and accumulates volume for each price level
Identifies high-volume nodes that often act as support or resistance levels
Uses percentile filtering to highlight the most significant trading areas
Key Features:
Automatic S/R Detection: Uses volume percentile filtering to identify the most significant price levels
Dynamic Support/Resistance Lines: Automatically draws horizontal black lines at high-volume areas that typically act as price magnets or barriers
Customizable Parameters: Full control over lookback period, number of price bars, percentile thresholds, profile width, opacity, and line projections
Clean Aesthetic: Monochrome design for professional chart presentation
Cerca negli script per "volume indicator"

Hello Crypto! Modern Combo Snapshot
Unified long/short analyzer blending EMA structure, SuperTrend, WaveTrend, QQE, and volume pressure.
Background shading flags “watch” and “ready” states; optional long/short modules let you focus on one side.
Alerts fire when every checklist item aligns, while the side-panel table summarizes trend, momentum, liquidity, and overall score in real time.
Indicator → Trend Analysis
Indicator → Momentum Oscillators
Indicator → Volume Indicators
Tags:
cryptocurrency, bitcoin, altcoins, trend-following, momentum, volume, ema, supertrend, intraday, swing-trading, alerts, checklist, trading-strategy, risk-management

CNagda-MomentumX - Institutional FlowMomentumX is designed to empower traders with a deeper understanding of market movements by focusing on Institutional Flow and advanced market structure analytics. The core goal is to identify and visualize where major market participants are operating, and to translate these complex footprints into clear, actionable trading signals — all in real time.
Real-time institutional activity mapping
Actionable entry and exit signals based on live market structure
Intuitive dashboard and dynamic chart visuals
Fully customizable modules for trend, liquidity, and order blocks
Core Logic Design
At the heart of MomentumX lies a robust algorithmic engine built to capture and surface institutional trading behavior. By leveraging advanced mathematical models, the indicator calculates institutional volume ratios and price momentum to pinpoint aggressive moves from large participants.
Institutional Volume & Price Momentum:
Utilizes custom volume indicators and price change analysis to detect strong buying or selling pressure, filtering out retail noise.
Liquidity Grab Detection & Activity Zones:
The script identifies liquidity grabs by monitoring abrupt price sweeps at major support/resistance levels—often where institutions trigger stop hunts or reversals. All critical activity zones are automatically color-coded on the chart for instant recognition.
Dashboard Visualization:
A fully dynamic dashboard table overlays live scores for accumulation, distribution, strength, and weakness—giving traders a real-time scan of market health.
Trendline & Order Block Architecture:
The logic auto-detects pivot highs/lows to draw smart trendlines, while the order block system highlights key reversal areas and breaker zones—making market structure clear and actionable.
MomentumX is packed with high-performance modules, each engineered to simplify complex market behavior and enhance decision-making for traders:
Institutional Flow Signals:
Instantly identifies spots where institutional players drive momentum, using unique volume and price activity analytics.
Bullish/Bearish Liquidity Grab Detection:
Marks abrupt price moves that signal stop hunts or reversals, letting traders anticipate snap-backs or trend shifts.
Trendline Auto-Detection:
Smartly draws trendlines based on significant swing highs and lows, automatically adjusting as price evolves.
Order Block System (Rejection/Breaker):
Spots and highlights key reversal zones with order block rectangles, confirming rejections or breakouts at strategic levels.
Dashboard and Bar Coloring:
A clean dashboard overlay presents live market scores, while dynamic bar coloring makes trend, strength, and high-activity periods instantly visible.
User Input Toggles for Each Module:
Every major feature is fully customizable—enable or disable modules to match individual trading setups or preferences.
Scripting/Development
MomentumX’s scripting process is modular, enabling clarity, scalability, and fast optimization throughout development:
Initialization & Inputs:
Start by defining all user input options, module toggles, color settings, and calculation parameters—ensuring maximum flexibility early on.
Core Calculation Functions:
Script advanced institutional volume and price momentum algorithms. Build out swing length logic, market state filters, and activity scoring methods.
Detection Engines:
Develop and integrate engines for liquidity grabs, automated trendline detection, and order block identification—each with dedicated functions for speed and precision.
Visual Overlays & Plotting:
Implement powerful plotting logic for colored bars, score dashboards, trendlines, reversal zones, and liquidity markers—making every data point clear and actionable on the chart.
Testing Handlers:
Add diagnostic panels and debug outputs to refine calculations and assure accuracy in every market environment.
Sample Trade Setups (Usage)
Cnagda MomentumX delivers clarity for multiple trading styles by providing timely, actionable setups grounded in institutional behavior and market structure. Here’s how traders can leverage the indicator for confident decision-making:
Liquidity Grab Reversal
Enter trades around detected liquidity grabs when price sweeps major support/resistance and the dashboard signals a momentum shift.
Example: Wait for a bullish/Bearish grab near market lows/high, with institutional flow turning positive/negative—enter long/short for potential mean reversion.
Order Block Breakout
Trade breakouts when price cleanly rejects or flips key order block zones highlighted on the chart.
Example: Short at a marked breaker block after a rejection signal, confirmed by a downward institutional activity spike.
Trendline Continuation
Ride established market moves by entering on trendline confirmations plotted by the auto-detect system.
Example: Go long after a trendline retest, confirmed by a green bar color and dashboard strength score.
Dashboard Confirmation
Combine dashboard metrics (strength, accumulation, distribution) with bar color overlays for multi-factor entries.
Example: Enter trades only when all market signals align in real time for maximum probability.
For Short Entry check -- Weakness : For Long Entry Check - Strength With Other Indications
MomentumX is not just another indicator – it’s your edge for reading the market like an insider. By transparently mapping institutional flow, uncovering hidden liquidity zones, and color-coding every major structure shift, MomentumX transforms complexity into actionable clarity. Whether you’re scalping, swing trading, or investing, you’ll gain a decisive, real-time advantage on every chart.
Embrace smarter decisions, adapt to changing market conditions instantly, and join a new generation of technically empowered traders.
Customize, observe, and let the market reveal opportunities in a way you’ve never experienced before.
Happy Trading

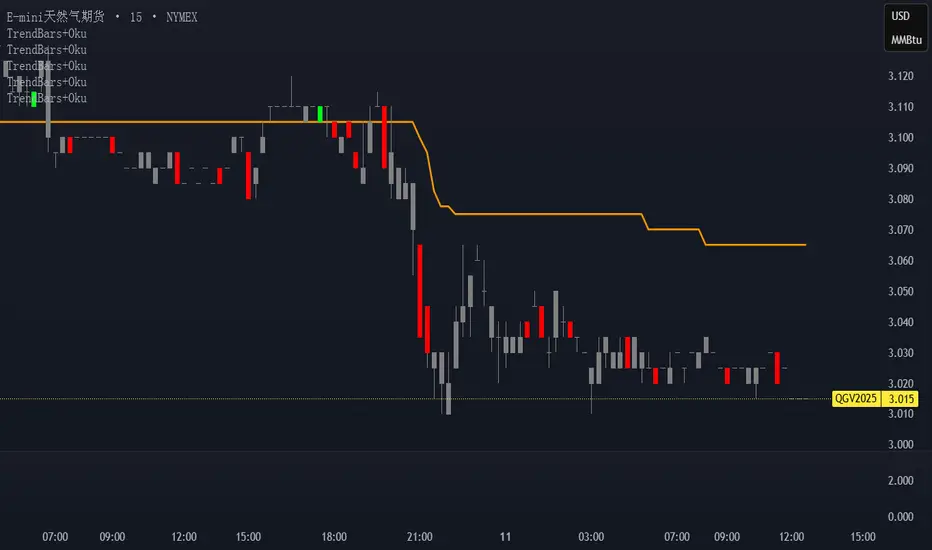
Trend Bars with Okuninushi Line Filter# Trend Bars with Okuninushi Line Filter: A Powerful Trading Indicator
## Introduction
The **Trend Bars with Okuninushi Line Filter** is an innovative technical indicator that combines two powerful concepts: trend bar analysis and the Okuninushi Line filter. This indicator helps traders identify high-quality trending moves by analyzing candle body strength relative to the overall price range while ensuring the price action aligns with the dominant market structure.
## What Are Trend Bars?
Trend bars are candles where the body (distance between open and close) represents a significant portion of the total price range (high to low). These bars indicate strong directional momentum with minimal indecision, making them valuable signals for trend continuation.
### Key Characteristics:
- **Strong directional movement**: Large body relative to total range
- **Minimal upper/lower shadows**: Shows sustained pressure in one direction
- **High conviction**: Represents decisive market action
## The Okuninushi Line Filter
The Okuninushi Line, also known as the Kijun Line in Ichimoku analysis, is calculated as the midpoint of the highest high and lowest low over a specified period (default: 52 periods).
**Formula**: `(Highest High + Lowest Low) / 2`
This line acts as a dynamic support/resistance level and trend filter, helping to:
- Identify the overall market bias
- Filter out counter-trend signals
- Provide confluence for trade entries
## How the Indicator Works
The indicator combines these two concepts with the following logic:
### Bull Trend Bars (Green)
A candle is colored **green** when ALL conditions are met:
1. **Bullish candle**: Close > Open
2. **Strong body**: |Close - Open| ≥ Threshold × (High - Low)
3. **Above trend filter**: Close > Okuninushi Line
### Bear Trend Bars (Red)
A candle is colored **red** when ALL conditions are met:
1. **Bearish candle**: Close < Open
2. **Strong body**: |Close - Open| ≥ Threshold × (High - Low)
3. **Below trend filter**: Close < Okuninushi Line
### Neutral Bars (Gray)
All other candles that don't meet the complete criteria are colored **gray**.
## Customizable Parameters
### Trend Bar Threshold
- **Range**: 10% to 100%
- **Default**: 75%
- **Purpose**: Controls how "strong" a candle must be to qualify as a trend bar
**Threshold Effects:**
- **Low (10-30%)**: More sensitive, catches smaller trending moves
- **Medium (50-75%)**: Balanced approach, filters out most noise
- **High (80-100%)**: Very selective, only captures the strongest moves
### Okuninushi Line Length
- **Default**: 52 periods
- **Purpose**: Determines the lookback period for calculating the midpoint
- **Common Settings**:
- 26 periods: More responsive to recent price action
- 52 periods: Standard setting, good balance
- 104 periods: Longer-term trend perspective
## Trading Applications
### 1. Trend Continuation Signals
- **Green bars**: Look for bullish continuation opportunities
- **Red bars**: Consider bearish continuation setups
- **Gray bars**: Exercise caution, mixed signals
### 2. Market Structure Analysis
- Clusters of same-colored bars indicate strong trends
- Alternating colors suggest choppy, indecisive markets
- Transition from red to green (or vice versa) may signal trend changes
### 3. Entry Timing
- Use colored bars as confirmation for existing trade setups
- Wait for color alignment with your market bias
- Avoid trading during predominantly gray periods
### 4. Risk Management
- Gray bars can serve as early warning signs of weakening trends
- Color changes might indicate appropriate exit points
- Use in conjunction with other risk management tools
## Advantages
1. **Dual Filtering**: Combines momentum (trend bars) with trend direction (Okuninushi Line)
2. **Visual Clarity**: Immediate visual feedback through candle coloring
3. **Customizable**: Adjustable parameters for different trading styles
4. **Versatile**: Works across multiple timeframes and instruments
5. **Objective**: Rule-based system reduces subjective interpretation
## Limitations
1. **Lagging Nature**: Based on historical price data
2. **False Signals**: Can produce whipsaws in choppy markets
3. **Parameter Sensitivity**: Requires optimization for different instruments
4. **Market Conditions**: May be less effective in ranging markets
## Best Practices
### Optimization Tips:
- **Volatile Markets**: Use higher thresholds (80-90%)
- **Steady Trends**: Use moderate thresholds (60-75%)
- **Short-term Trading**: Shorter Okuninushi Line periods (26)
- **Long-term Analysis**: Longer Okuninushi Line periods (104+)
### Combination Strategies:
- Pair with volume indicators for confirmation
- Use alongside support/resistance levels
- Combine with other trend-following indicators
- Consider market context and overall trend direction
## Conclusion
The Trend Bars with Okuninushi Line Filter offers traders a sophisticated yet intuitive way to identify high-quality trending moves. By combining the momentum characteristics of trend bars with the directional filter of the Okuninushi Line, this indicator helps traders focus on the most promising opportunities while avoiding low-probability setups.
Remember that no single indicator should be used in isolation. Always consider market context, risk management, and other technical factors when making trading decisions. The true power of this indicator lies in its ability to quickly highlight periods of strong, aligned price action – exactly what trend traders are looking for.
---
*Disclaimer: This article is for educational purposes only and should not be considered as financial advice. Always conduct your own research and consider your risk tolerance before making any trading decisions.*
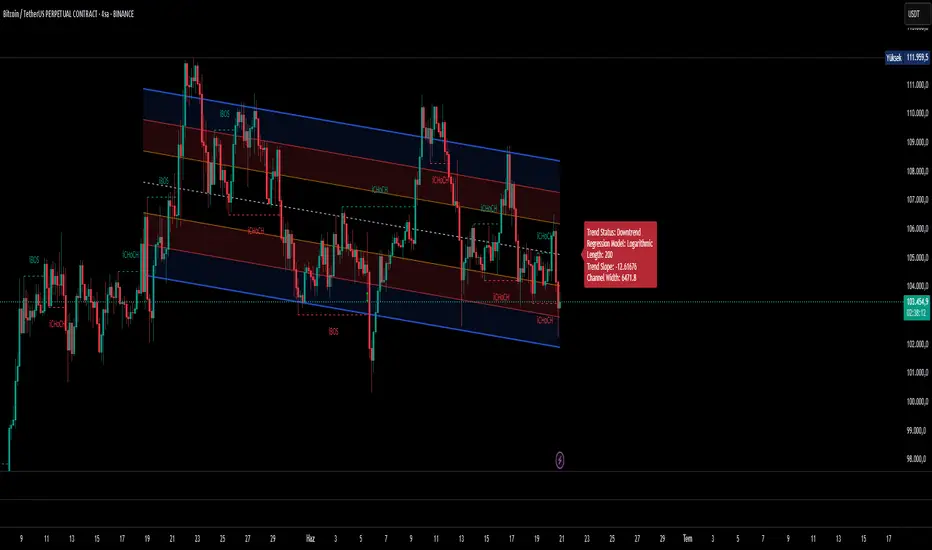
Ultimate Regression Channel v5.0 [WhiteStone_Ibrahim]Ultimate Regression Channel v5.0: Comprehensive User Guide
This indicator is designed to visualize the current trend, potential support/resistance levels, and market volatility through a statistical analysis of price action. At its core, it plots a regression line (a trend line) based on prices over a specific period and adds channels based on standard deviation around this line.
1. Core Features and Settings
Length Mode:
Numerical (Manual): You define the number of bars to be used for the regression channel calculation. You can use lower values (e.g., 50-100) for short-term analysis and higher values (e.g., 200-300) to identify long-term trends.
Automatic (Based on Market Structure): This mode automatically draws the channel starting from the highest high or lowest low that has formed within the Auto Scan Period. This allows the indicator to adapt itself to significant market turning points (swing points), which is highly useful.
Regression Model:
Linear: Calculates the trend as a straight line. It generally works well in stable, short-to-medium-term trends.
Logarithmic: Calculates the trend as a curved line. It more accurately reflects price action, especially on long-term charts or for assets that experience exponential growth/decline (like cryptocurrencies or growth stocks).
Channel Widths:
These settings determine how far from the central trend line (in terms of standard deviations) the channels will be drawn.
The 0 (Inner), 1 (Middle), and 2 (Outer) channels represent the "normal" range of price movement and the "extreme" zones. Statistically, about 95% of all price action occurs within the outer channels (2nd standard deviation).
2. Visual Extras and Their Interpretation
Breakout Style:
This feature alerts you when the price closes above the uppermost channel (Channel 2) with a green arrow/background or below the lowermost channel with a red arrow/background.
This is a very important signal. A breakout can signify that the current trend is strengthening and likely to continue (a breakout/trend-following strategy) or that the market has become overextended and may be due for a reversal (an exhaustion/top-bottom signal). It is critical to confirm this signal with other indicators (e.g., RSI, Volume).
Info Label:
This provides an at-a-glance summary of the channel on the right side of the chart:
Trend Status: Identifies the trend as "Uptrend," "Downtrend," or "Sideways" based on the slope of the centerline. The Horizontal Threshold setting allows you to filter out noise by treating very small slopes as "Sideways."
Regression Model and Length: Shows your current settings.
Trend Slope: A numerical value representing how steep or weak the trend is.
Channel Width: Shows the price difference between the outermost channels. This is a measure of current volatility. A widening channel indicates increasing volatility, while a narrowing one indicates decreasing volatility.
3. What Users Should Pay Attention To & Best Practices
Define Your Strategy: Mean Reversion or Breakout?
Mean Reversion: If the market is in a ranging or gently trending phase, the price will tend to revert to the centerline after hitting the outer channels (overbought/oversold zones). In this case, the outer channels can be considered opportunities to sell (upper channel) or buy (lower channel).
Breakout: If a strong trend is in place, a price close beyond an outer channel can be a sign that the trend is accelerating. In this scenario, one might consider taking a position in the direction of the breakout. Correctly analyzing the current market state (ranging vs. trending) is key to deciding which strategy to employ.
Don't Use It in Isolation: No indicator is a holy grail. Use the Regression Channel in conjunction with other tools. Confirm signals with RSI divergences for overbought/oversold conditions, Moving Averages for the overall trend direction, or Volume indicators to confirm the strength of a breakout.
Choose the Right Model: On shorter-term charts (e.g., 1-hour, 4-hour), the Linear model is often sufficient. However, on long-term charts like the daily, weekly, or monthly, the Logarithmic model will provide much more accurate results, especially for assets with parabolic movements.
The Power of Automatic Mode: The Automatic length mode is often the most practical choice because it finds the most logical starting point for you. It saves you the trouble of adjusting settings, especially when analyzing different assets or timeframes.
Use the Alerts: If you don't want to miss the moment the price touches a key channel line, set up an alert from the Alert Settings section for your desired line (e.g., only the "Outer Channels"). This helps you catch opportunities even when you are not in front of the screen.
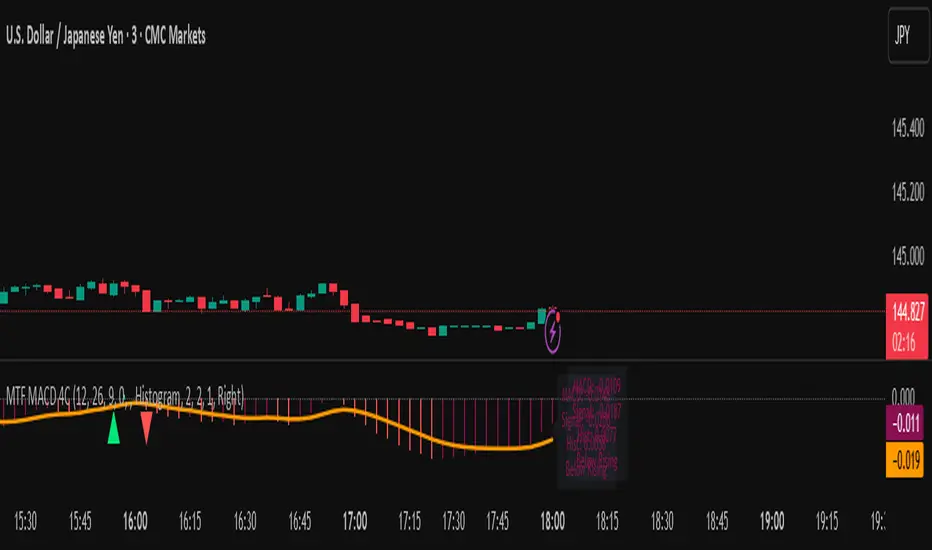
MTF MACD 4-Color Momentum System🎯 Overview
The MTF MACD 4-Color Momentum System is an advanced MACD indicator that provides crystal-clear momentum visualization through an innovative 4-color state system. Unlike traditional MACD indicators that only show positive/negative values, this indicator identifies four distinct market states to help traders make more informed decisions.
📊 Key Features
1. Four-State Color System:
🟢 Lime: Above zero + Rising (Strong Bullish Momentum)
🟢 Dark Green: Above zero + Falling (Weakening Bullish Momentum)
🔴 Red: Below zero + Falling (Strong Bearish Momentum)
🔴 Maroon: Below zero + Rising (Weakening Bearish Momentum)
2. Multi-Timeframe Analysis:
View higher timeframe MACD on lower timeframe charts
Confirm trends across multiple timeframes
Reduce false signals with multi-timeframe confluence
3. Flexible Display Options:
Three visualization styles: Histogram, Columns, or Line
Toggle individual color states on/off
Customizable colors and line widths
4. Advanced Features:
Optional histogram smoothing to reduce noise
Zero-cross alerts with visual markers
Color state change alerts
Real-time value display
Customizable signal line overlay
💡 How to Use
1. Momentum Identification:
Lime bars indicate strong upward momentum - ideal for long entries
Dark green suggests momentum is slowing - consider taking profits
Red bars show strong downward momentum - ideal for short entries
Maroon indicates potential reversal brewing - prepare for direction change
2. Zero Line Crosses:
Blue triangles mark bullish crosses above zero
Pink triangles mark bearish crosses below zero
Use these as confirmation signals with other indicators
3. Multi-Timeframe Confirmation:
Set to higher timeframe (e.g., 4H on 15m chart)
Look for alignment between timeframes before entering trades
Avoid trades against higher timeframe momentum
⚙️ Settings Guide
MACD Parameters:
Fast EMA: 12 (default) - Adjust for more/less sensitivity
Slow EMA: 26 (default) - Standard MACD setting
Signal: 9 (default) - Smoothing period
Display Customization:
Choose between Histogram, Columns, or Line display
Enable/disable specific color states
Adjust visual properties to match your chart theme
Alerts:
Zero cross alerts for trend changes
Color state alerts for momentum shifts
📈 Trading Strategies
1. Momentum Continuation:
Enter longs when MACD turns lime (above zero + rising)
Enter shorts when MACD turns red (below zero + falling)
Exit when color shifts to "weakening" state
2. Reversal Trading:
Watch for maroon in downtrends (potential bottom)
Watch for dark green in uptrends (potential top)
Confirm with price action and support/resistance
3. Multi-Timeframe Confluence:
Use daily MACD on 1H chart for trend direction
Enter on lower timeframe signals in direction of higher timeframe
Avoid counter-trend trades when higher timeframe shows strong momentum
🎓 Pro Tips
Combine with volume indicators for confirmation
Use with support/resistance levels for better entries
Enable smoothing in choppy markets to reduce false signals
Pay attention to divergences between price and MACD
⚠️ Risk Disclaimer
This indicator is for educational purposes only. Always use proper risk management and combine with other analysis methods. Past performance does not guarantee future results.
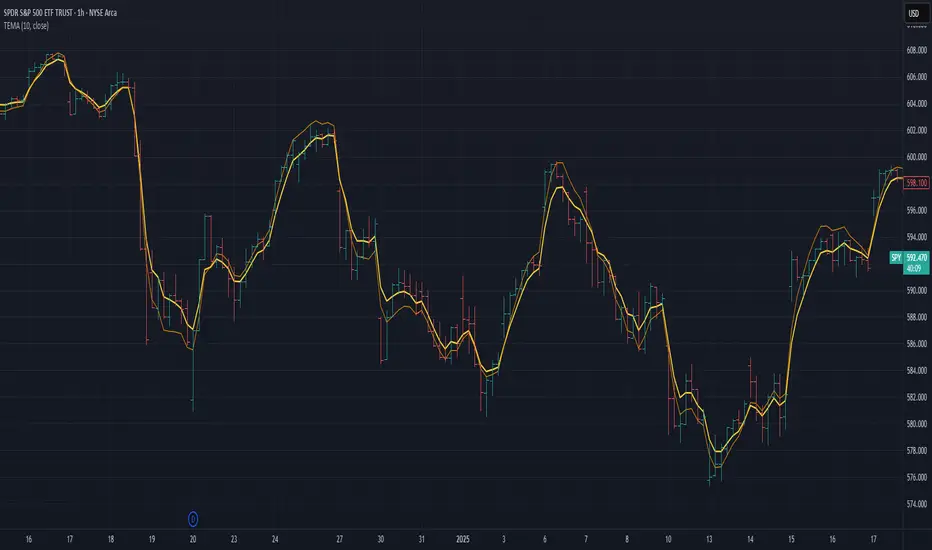
Triple Exponential Moving Average (TEMA)The Triple Exponential Moving Average (TEMA) is an advanced technical indicator designed to significantly reduce the lag inherent in traditional moving averages while maintaining signal quality. Developed by Patrick Mulloy in 1994 as an extension of his DEMA concept, TEMA employs a sophisticated triple-stage calculation process to provide exceptionally responsive market signals.
TEMA's mathematical approach goes beyond standard smoothing techniques by using a triple-cascade architecture with optimized coefficients. This makes it particularly valuable for traders who need earlier identification of trend changes without sacrificing reliability. Since its introduction, TEMA has become a key component in many algorithmic trading systems and professional trading platforms.
▶️ **Core Concepts**
Triple-stage lag reduction: TEMA uses a three-level EMA calculation with optimized coefficients (3, -3, 1) to dramatically minimize the delay in signal generation
Enhanced responsiveness: Provides significantly faster reaction to price changes than standard EMA or even DEMA, while maintaining reasonable smoothness
Strategic signal processing: Employs mathematical techniques to extract the underlying trend while filtering random price fluctuations
Timeframe effectiveness: Performs well across multiple timeframes, though particularly valued in short to medium-term trading
TEMA achieves its enhanced responsiveness through an innovative triple-cascade architecture that strategically combines three levels of exponential moving averages. This approach effectively removes the lag component inherent in EMA calculations while preserving the essential smoothing benefits.
▶️ **Common Settings and Parameters**
Length: Default: 12 | Controls sensitivity/smoothness | When to Adjust: Increase in choppy markets, decrease in strongly trending markets
Source: Default: Close | Data point used for calculation | When to Adjust: Change to HL2/HLC3 for more balanced price representation
Corrected: Default: false | Adjusts internal EMA smoothing factors for potentially faster response | When to Adjust: Set to true for a modified TEMA that may react quicker to price changes. false uses standard TEMA calculation
Visualization: Default: Line | Display format on charts | When to Adjust: Use filled cloud to see divergence from price more clearly
Pro Tip: For optimal trade signals, many professional traders use two TEMAs (e.g., 8 and 21 periods) and look for crossovers, which often provide earlier signals than traditional moving average pairs.
▶️ **Calculation and Mathematical Foundation**
Simplified explanation:
TEMA calculates three levels of EMAs, then combines them using a special formula that amplifies recent price action while reducing lag. This triple-processing approach effectively eliminates much of the delay found in traditional moving averages.
Technical formula:
TEMA = 3 × EMA₁ - 3 × EMA₂ + EMA₃
Where:
EMA₁ = EMA(source, α₁)
EMA₂ = EMA(EMA₁, α₂)
EMA₃ = EMA(EMA₂, α₃)
The smoothing factors (α₁, α₂, α₃) are determined as follows:
Let α_base = 2/(length + 1)
α₁ = α_base
If corrected is false:
α₂ = α_base
α₃ = α_base
If corrected is true:
Let r = (1/α_base)^(1/3)
α₂ = α_base * r
α₃ = α_base * r * r = α_base * r²
The corrected = true option implements a variation that uses progressively smaller alpha values for the subsequent EMA calculations. This approach aims to optimize the filter's frequency response and phase lag.
Alpha Calculation for corrected = true:
α₁ (alpha_base) = 2/(length + 1)
r = (1/α₁)^(1/3) (cube root relationship)
α₂ = α₁ * r = α₁^(2/3)
α₃ = α₂ * r = α₁^(1/3)
Mathematical Rationale for Corrected Alphas:
1. Frequency Response Balance:
The standard TEMA (where α₁ = α₂ = α₃) can lead to an uneven frequency response, potentially over-smoothing high frequencies or creating resonance artifacts. The geometric progression of alphas (α₁ > α₁^(2/3) > α₁^(1/3)) in the corrected version aims to create a more balanced filter cascade. Each stage contributes more proportionally to the overall frequency response.
2. Phase Lag Optimization:
The cube root relationship between the alphas is designed to minimize cumulative phase lag while maintaining smoothing effectiveness. Each subsequent EMA stage has a progressively smaller impact on phase distortion.
3. Mathematical Stability:
The geometric progression (α₁, α₁^(2/3), α₁^(1/3)) can enhance numerical stability due to constant ratios between consecutive alphas. This helps prevent the accumulation of rounding errors and maintains consistent convergence properties.
Practical Impact of corrected = true:
This modification aims to achieve:
Potentially better lag reduction for a similar level of smoothing
A more uniform frequency response across different market cycles
Reduced overshoot or undershoot in trending conditions
Improved signal-to-noise ratio preservation
Essentially, the cube root relationship in the corrected TEMA attempts to optimize the trade-off between responsiveness and smoothness that can be a challenge with uniform alpha values.
🔍 Technical Note: Advanced implementations apply compensation techniques to all three EMA stages, ensuring TEMA values are valid from the first bar without requiring a warm-up period. This compensation corrects initialization bias and prevents calculation errors from compounding through the cascade.
▶️ **Interpretation Details**
TEMA excels at identifying trend changes significantly earlier than traditional moving averages, making it valuable for both entry and exit signals:
When price crosses above TEMA, it often signals the beginning of an uptrend
When price crosses below TEMA, it often signals the beginning of a downtrend
The slope of TEMA provides insight into trend strength and momentum
TEMA crossovers with price tend to occur earlier than with standard EMAs
When multiple-period TEMAs cross each other, they confirm significant trend shifts
TEMA works exceptionally well as a dynamic support/resistance level in trending markets
For optimal results, traders often use TEMA in combination with momentum indicators or volume analysis to confirm signals and reduce false positives.
▶️ **Limitations and Considerations**
Market conditions: The high responsiveness can generate false signals during highly choppy, sideways markets
Overshooting: More aggressive lag reduction leads to more pronounced overshooting during sharp reversals
Parameter sensitivity: Changes in length have more dramatic effects than in simpler moving averages
Calculation complexity: Triple cascaded EMAs make behavior less predictable and more resource-intensive
Complementary tools: Should be used with confirmation tools like RSI, MACD or volume indicators
▶️ **References**
Mulloy, P. (1994). "Smoothing Data with Less Lag," Technical Analysis of Stocks & Commodities .
Mulloy, P. (1995). "Comparing Digital Filters," Technical Analysis of Stocks & Commodities .
Wick SweepThe Wick Sweep indicator identifies potential trend reversal zones based on price action patterns and swing points. Specifically, it looks for "Wick Sweeps," a concept where the market temporarily breaks a swing low or high (creating a "wick"), only to reverse in the opposite direction. This pattern is often indicative of a market attempting to trap traders before making a larger move. The indicator marks these zones using dashed lines, helping traders spot key areas of potential price action.
Key Features:
* Swing Low and High Detection: The indicator identifies significant swing lows and highs within a user-defined period by employing Williams fractals.
* Wick Sweep Detection: Once a swing low or high is identified, the indicator looks for price movements that break through the low or high (creating a wick) and then reverses direction.
* Fractal Plotting: Optionally, the indicator plots fractal points (triangle shapes) on the chart when a swing low or high is detected. This can assist in visually identifying the potential wick sweep areas.
* Line Plotting: When a wick sweep is detected, a dashed line is drawn at the price level of the failed low or high, visually marking the potential reversal zone.
Inputs:
* Periods: The number of bars used to identify swing highs and lows. A higher value results in fewer, more significant swing points.
* Line Color: The color of the dashed lines drawn when a wick sweep is detected. Customize this to match your chart's theme or preferences.
* Show Fractals: A toggle that, when enabled, plots triangle shapes above and below bars indicating swing highs (up triangles) and swing lows (down triangles).
Functionality:
* Swing High and Low Calculation:
- The indicator calculates the swing low and swing high based on the periods input. A swing low is identified when the current low is the lowest within a range of (2 * periods + 1), with the lowest point being at the center of the period.
- Similarly, a swing high is identified when the current high is the highest within the same range.
* Wick Sweep Detection:
- Once a swing low or high is detected, the script looks for a potential wick. This happens when the price breaks the swing low or high and then reverses in the opposite direction.
- For a valid wick sweep, the price should briefly move beyond the identified swing point but then close in the opposite direction (i.e., a bullish reversal for a swing low and a bearish reversal for a swing high).
- A line is drawn at the price level of the failed low or high when a wick sweep is confirmed.
Confirmations for Reversal:
* The confirmation for a wick sweep requires that the price not only break the swing low/high but also close in the opposite direction (i.e., close above the low for a bullish reversal or close below the high for a bearish reversal).
* The confirmation is further refined by checking that the price movement is within a reasonable distance from the original swing point, which prevents the indicator from marking distant, unimportant price levels.
Additional Notes:
* The Wick Sweep indicator does not provide standalone trading signals; it is best used in conjunction with other technical analysis tools, such as trend analysis, oscillators, or volume indicators.
* The periods input can be adjusted based on the trader’s preferred level of sensitivity. A lower period value will result in more frequent swing points and potentially more signals, while a higher value will focus on more significant market swings.
* The indicator may work well in ranging markets where price tends to oscillate between key support and resistance levels.

Stacked Bullish vs Bearish VolumeThis indicator visually represents buying (bullish) and selling (bearish) pressure within each candle by stacking both portions inside a single volume bar. Unlike traditional volume indicators that use only one color per bar, this script splits each volume bar into two segments:
Green portion (Bullish Volume) → Represents the buying pressure when the price moves up.
Red portion (Bearish Volume) → Represents the selling pressure when the price moves down.
By stacking buy and sell volume inside the same column, traders can easily assess the balance of buying vs selling activity within each trading session.
Stacking the Bars:
The bullish portion (green) is plotted first.
The bearish portion (red) is plotted slightly offset to create a stacked effect.

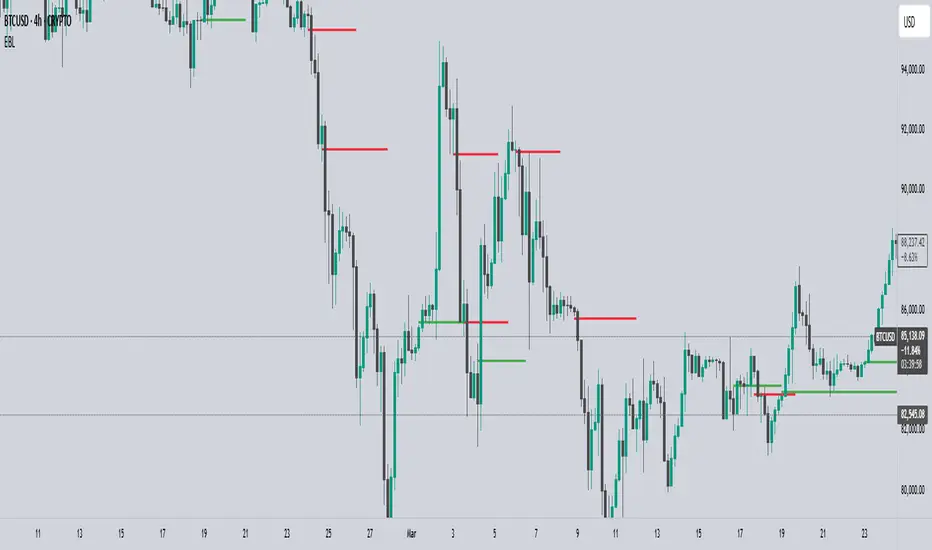
EBL - Enigma BOS LogicThe EBL - Enigma BOS Logic indicator is designed to detect key trend reversal points with precision by leveraging a unique concept based on two-candle price action analysis. Inspired by the balance of pairs in creation, this indicator identifies trend changes by focusing on significant bullish and bearish candle pairs, storing key levels, and waiting for confirmation to provide actionable trade signals. It goes beyond conventional trend-following indicators by offering real-time alerts and clear visual cues for traders.
How It Works
Bullish Setup:
The indicator identifies a bullish candle followed by a bearish candle. It then stores the high of the bullish candle as a potential reversal level.
A bullish confirmation occurs when a future bullish candle closes above the stored high. When this happens:
A green arrow is plotted below the confirming candle.
A horizontal green line is drawn at the stored high level, extending forward by a user-defined number of bars.
An alert is triggered to notify the trader of a confirmed bullish trend.
Bearish Setup:
The indicator identifies a bearish candle followed by a bullish candle. It stores the low of the bearish candle as a potential reversal level.
A bearish confirmation occurs when a future bearish candle closes below the stored low. When this happens:
A red arrow is plotted above the confirming candle.
A horizontal red line is drawn at the stored low level, extending forward by a user-defined number of bars.
An alert is triggered to notify the trader of a confirmed bearish trend.
Touch or Cross Alerts:
In addition to initial trend confirmation, the indicator tracks price movements relative to the drawn horizontal lines.
If the price returns to touch or cross a previously drawn horizontal line, an alert is triggered, indicating a potential re-entry or retracement opportunity.
Customization Options
To make the indicator versatile and adaptable for different trading styles, several customization options are provided:
Line Colors: Traders can customize the colors of the bullish and bearish lines.
Show/Hide Arrows and Lines: Users can choose whether to display the arrows and horizontal lines on the chart.
Line Length: The length of the horizontal lines (number of bars they extend into the future) is user-defined, offering flexibility based on trading timeframes and preferences.
Use Cases
Trend Reversal Detection: EBL is ideal for identifying key trend reversals, allowing traders to enter trades with a high probability of success.
Breakout Confirmation: The indicator provides visual and alert-based confirmation of breakouts beyond critical support or resistance levels.
Re-entry Opportunities: With alerts for price touching or crossing horizontal lines, traders can spot potential re-entry points during retracements.
Conceptual Foundation
The methodology behind this indicator is rooted in the principle that markets often move in pairs of bullish and bearish forces. By tracking the interaction between consecutive bullish and bearish candles and waiting for clear confirmations, this indicator ensures that only high-probability trend changes are signaled. This reduces noise and enhances trading accuracy, making it suitable for scalping, day trading, and swing trading across various timeframes.
How to Use
Apply the indicator to any chart and timeframe of your choice.
Set your preferred customization options, including line colors, arrow display, and line length.
Watch for arrows and listen for alerts to identify confirmed trend changes.
Pay attention to touch or cross alerts on horizontal lines, as these can signal potential re-entry or secondary trade opportunities.
Combine with other analysis: While EBL is powerful on its own, combining it with support/resistance analysis, moving averages, or volume indicators can further enhance its effectiveness.
This indicator is a powerful tool for traders seeking precision in identifying trend changes and actionable trade signals. Its unique logic, real-time alerts, and clear visual cues make it a valuable addition to any trader’s toolkit.
Multi-Symbol Scanner: Advanced EMA-RSI-Volume Strategy# Multi-Symbol Tech Stock Scanner: Advanced EMA-RSI-Volume Strategy
## Technical Analysis Methodology
This scanner implements a sophisticated multi-timeframe analysis approach combining three key technical elements:
### 1. Dual EMA System (Primary Trend Detection)
- **Long-term EMA (820 periods)**: Acts as the primary trend identifier
- Chosen specifically for tech stocks' longer-term price waves
- Helps filter out minor market noise while capturing major trend changes
- 820 periods approximately represents 3.2 years of trading days
- **Medium-term EMA (320 periods)**: Serves as trend confirmation
- Approximately 1.25 years of trading data
- Provides earlier entry signals while maintaining trend reliability
- Helps identify potential trend reversals before the major trend shift
### 2. Volume Analysis Component
The script employs a dynamic volume analysis system:
- Calculates 20-period moving average of volume as baseline
- Requires 1.5x surge above baseline for signal confirmation
- Volume surge requirement helps filter out weak moves and potential false breakouts
- Different from standard volume indicators as it uses adaptive thresholds
### 3. RSI Momentum Filter
Implements a specialized RSI configuration:
- 14-period RSI with dynamic overbought/oversold levels
- Oversold threshold: 30 (customizable)
- Overbought threshold: 70 (customizable)
- Used as a confirmation tool rather than primary signal generator
## Signal Generation Logic
### Buy Signal Requirements
1. Price must cross above 820 EMA (PRIMARY CONDITION)
2. Current price must be above 320 EMA (CONFIRMATION)
3. RSI must be above 30 but below 70 (MOMENTUM CHECK)
4. Volume must be 1.5x above 20-period average (STRENGTH VALIDATION)
### Sell Signal Requirements
1. Price must cross below 820 EMA (PRIMARY CONDITION)
2. Current price must be below 320 EMA (CONFIRMATION)
3. RSI must be above 30 but below 70 (MOMENTUM CHECK)
4. Volume must be 1.5x above 20-period average (STRENGTH VALIDATION)
## Risk Management Integration
The script automatically calculates key risk levels based on volatility:
1. **Stop Loss Calculation**:
- Default: 2% below entry for buys
- Dynamically adjusted based on price point
- Can be modified through input parameters
2. **Take Profit Targets**:
- Primary target: 6% above entry (3:1 reward-risk ratio)
- Based on historical tech stock movement patterns
- Adjustable through input parameters
## Multi-Symbol Implementation
The scanner monitors 6 symbols simultaneously using:
- Separate security calls for each data point
- Optimized data requests to prevent overload
- Individual signal processing for each symbol
- Synchronized alert generation system
## Technical Implementation Details
1. **Data Processing**:
```
- Security data requests on 10-minute timeframe
- Individual EMA calculations per symbol
- Separate volume analysis threads
- RSI calculations with standard deviation normalization
```
2. **Signal Processing**:
```
- Cross-verification of all conditions
- Time-based signal validation
- Volume surge confirmation
- Trend alignment check
```
3. **Alert System**:
```
- Bar-close confirmation required
- Multi-condition validation
- Detailed price level inclusion
- Risk parameter integration
```
## Optimization Features
1. **Memory Usage**:
- Optimized security calls
- Efficient data structure
- Reduced redundant calculations
2. **Processing Efficiency**:
- Single-pass data analysis
- Combined indicator calculations
- Streamlined alert generation
## Practical Application
The system is designed for:
1. Swing Trading (primary use)
2. Position Trading (secondary use)
3. Technical Breakout Trading
Optimal timeframes:
- Primary: 4H charts
- Secondary: Daily charts
- Verification: 1H charts
## Default Configuration
The scanner is preset to monitor key tech stocks:
- TSLA: High-volatility tech leader
- NVDA: Semiconductor sector benchmark
- AVGO: Stable tech infrastructure
- TSM: Global chip manufacturer
- META: Social media sector leader
- AMZN: E-commerce/Cloud computing leader
Each symbol can be modified through input parameters.
## Version Information
- Current Version: 1.3
- Last Updated: November 2024
- Compatibility: TradingView Pro/Pro+/Premium
## Limitations & Considerations
- Limited to 6 symbols due to TradingView security request limits
- Requires consistent market volume for optimal performance
- Best suited for liquid stocks with significant daily volume
- May need parameter adjustments during extreme market conditions

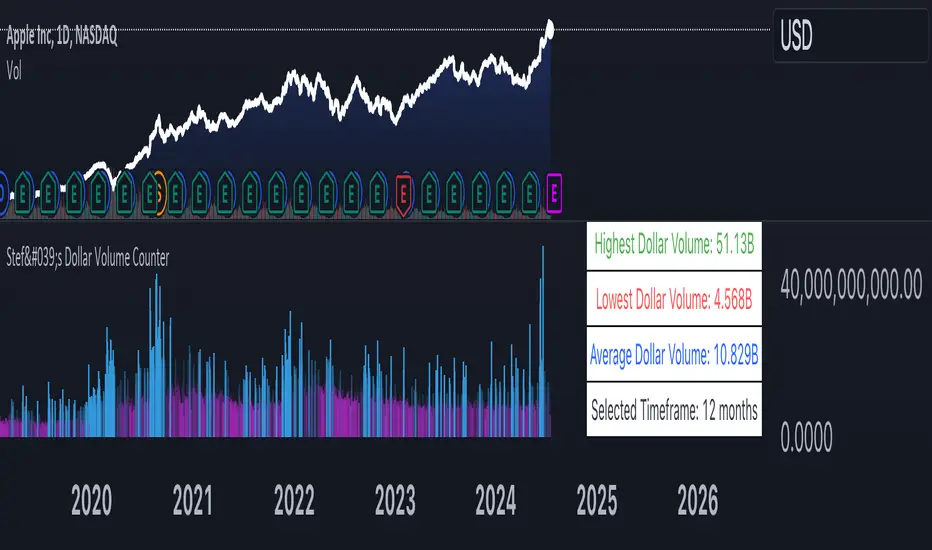
Stef's Dollar Volume CounterStef's Dollar Volume Counter is my second script that I've worked on and coded. I am proud of this script because it does something very, very important: it counts the AMOUNT of money traded, not just the amount shares/contracts traded. This is key for understanding where the big and small money is.
This script is totally different from other Volume scripts because it shows the amount of money traded, NOT the shares/contracts/coins etc. Also, more importantly, it is different from other volume indicators in the same space because this script is specifically focused on showcasing specific dollar volume amounts either as a table or as a label.
Here are the 5 key features you can utilize with this:
1. Customizable Gradient Colors for BIG money and SMALL money: Visually distinguishes between high and low dollar volumes. Change the colors as needed in the indicator settings menu.
2. Dollar Volume Counter Table: Positioned at the bottom right of the chart, this table provides quick insights into the highest, lowest, and average dollar volumes over a specified period. You can customize the time period in the settings menu.
3. "Wow! Much Money!" Labels: Highlights the top three recent highest dollar volumes within the visible chart area, emphasizing significant trading periods. Also, it's hilarious :)
4. Customize the period for volume analysis, ranging from 1 to 12 months or more, with the selected timeframe displayed in the table.
5. It opens as a new pane below the chart so that you can still analyze price and more, as needed.
Thanks for reading! I look forward to hearing your feedback. This script will be updated to expand on more concepts and I'll add some cool features soon.
Klinger Oscillator AdvancedThe Klinger Oscillator is not fully implemented in Tradeview. While the description at de.tradingview.com is complete, the implementation is limited to the pure current volume movement. This results in no difference compared to the On Balance Volume indicator.
However, Klinger's goal was to incorporate the trend as volume force in its strength and duration into the calculation. The expression ((V x x T x 100)) for volume force only makes sense as an absolute value, which should probably be expressed as ((V x abs(2 x ((dm/cm) - 1)) x T x 100)). Additionally, there is a need to handle the theoretical possibility of cm == 0.
Since, in general, significantly more trading volume occurs at the closing price than during the day, an additional parameter for weighting the closing price is implemented. In intraday charts, considering the closing price, in my opinion, does not make sense.
The TradeView implementation is displayed on the chart for comparison. Particularly in the analysis of divergence, significant deviations become apparent.

[VWMA] Net Volume LibraryLibrary " Net Volume Library"
TODO: The underlying logic and function that calculates the net volume for the Net Volume indicator. Exposes the nv function and nvPoint fields for use.
nv(src, length, useVwma, offset, sigma, multHigh, multMed, multLow)
Parameters:
src : (float) The source price value
length : (int) The lookback length
useVwma : (bool) To use VWMA in the calculation or not
offset : (float) The ALMA offset value
sigma : (int) The ALMA sigma value
multHigh : (float) The multiplier high band
multMed : (float) The multiplier medium band
multLow : (float) The multiplier low band
Returns: Returns the calculated net volume for each band in an nvPoint object
nvPoint
Fields:
h2
h1
h
n
l
l1
l2

scalping with market facilitationThis strategy is for scalping low timeframes for 10 pips. I have yet to see a strategy with this unique combo of indicators.
First we have volume indicator market facilitation, where we are looking for volume and mfi to be up, then we want the adx 5 to be above level 30 and above its ema period 3, then if these conditions are good we take shorts when ema 8 is below ema 100 and longs when ema8 is above ema 100 with parabolic sar in its propet place, also to verify trend we have obv over or under its ema of 55 and macd line over its signal line.
I have heikenashi bars on with the regular priceline showing so j see actual price levels, when i get a buy signal i set a buystop above the high of that bar and have a stoploss of 7.5 pips and a take profit of 10 pips, reverse for sells, i have to use metatrader to trade so i use this as my signals to trade.
Note this is not advice trade at your own risk no guarantees in anything in life, but i wanted to share this for it is helping me with my trades to be more strict and semi mechanical. I use it for forex time frames 1 3 5 15 mjn

Stochastic Slow and OBV Percent Oscillator
Purpose - Stochastic is the best momentum indicator and On Balance Volume (OBV) is the best volume indicator. Why not combine both to come up with a more sophisticated oscillator?
How It's Done - I had to put OBV as an oscillator (returning values between 0 and 100) in order to put it in the same pane with the slow stochastic oscillator. Otherwise, their synergy won't be that great. So, I have decided to visualize OBV as a percentage relative to selected period's high and low value. That way, I can keep the OBV value to stay within boundary.
Interpretation
1. Dot color indicates the whether the stochastic K/OBV is over or below the stochastic D/Signal line.
2. When Stoch and OBV are moving in the same direction and are close together (on top of each other), this indicates a strong trend
3. When Stoch crosses up or down the OBV oscillator, it may indicate a trend reversal

Everything Bitcoin [Kioseff Trading]Hello!
This script retrieves most of the available Bitcoin data published by Quandl; the script utilizes the new request.security_lower_tf() function.
Included statistics,
True price
Volume
Difficulty
My Wallet # Of Users
Average Block Size
api.blockchain size
Median Transaction Confirmation Time
Miners' Revenue
Hash Rate
Cost Per Transaction
Cost % of Transaction Volume
Estimated Transaction Volume USD
Total Output Volume
Number Of Transactions Per Block
# of Unique BTC Addresses
# of BTC Transactions Excluding Popular Addresses
Total Number of Transactions
Daily # of Transactions
Total Transaction Fees USD
Market Cap
Total BTC
Retrieved data can be plotted as line graphs; however, the data is initially split between two tables.
The image above shows how the requested Bitcoin data is displayed.
However, in the user inputs tab, you can modify how the data is displayed.
For instance, you can append the data displayed in the floating statistics box to the stagnant statistics box.
The image above exemplifies the instance.
You can hide any and all data via the user inputs tab.
In addition to data publishing, the script retrieves lower timeframe price/volume/indicator data, to which the values of the requested data are appended to center-right table.
The image above shows the script retrieving one-minute bar data.
Up arrows reflect an increase in the more recent value, relative to the immediately preceding value.
Down arrows reflect a decrease in the more recent value relative to the immediately preceding value.
The ascending minute column reflects the number of minutes/hours (ago) the displayed value occurred.
For instance, 15 minutes means the displayed value occurred 15 minutes prior to the current time (value).
Volume, price, and indicator data can be retrieved on lower timeframe charts ranging from 1 minute to 1440 minutes.
The image above shows retrieved 5-minute volume data.
Several built-in indicators are included, to which lower timeframe values can be retrieved.
The image above shows LTF VWAP data. Also distinguished are increases/decreases for sequential values.
The image above shows a dynamic regression channel. The channel terminates and resets each fiscal quarter. Previous channels remain on the chart.
Lastly, you can plot any of the requested data.
The new request.security_lower_tf() function is immensely advantageous - be sure to try it in your scripts!

Volume & Highlights
Large or small volume bars are highlighted.
Normal bars are using the same colors as the built-in volume indicator.

Kifier's MFI/STOCH Hidden Divergence/Trend BeaterMFI/STOCH Hidden Divergence/Trend Beater
General Idea:
My premise around this strategy was to make a general strategy for crypto that would help out with finding entry positions for when you’re bullish on a crypto and want to hold on for a while, and at the same time avoiding massive drops. Essentially a way to mix long term/ swing trading; I somewhat achieved my goal however it still requires a lot of logic tuning of the trend averages.
I’m a huge proponent of volume indicators and coupled with average closing price, I think this gives a really good idea of what is happening with the market. It gives an idea on the market and retail investor sentiment. This generally gives you logical entry positions (Although I don’t know how amazing that will work with all cryptos, there’s a fine line between a good strategy and one that just rides bubble market conditions, some would argue that’s still a success and others not)
How it works:
There are many components to the strategy that try to do different things:
First of all there are two types of entries, a MFI hidden divergence with a STOCH check, essentially it will only fire when a divergence is detected while STOCH is above 50%, however this might be changed in the future as due to the volatile nature of cryptos, the STOCH is not too effective. The second entry is a simple MFI/STOCH trend, if STOCH is above 50% and the trend is detected to be in a trending long, once a MFI crossover over the 50% line is detected an entry is placed, this is designed to get out profit where the divergence would otherwise be less accurate during strongly trending conditions.
-MFI is a great indicator, as a volume weighted momentum indicator I find it the most accurate of all, the STOCH however is a great indicator to get a general picture of simple market conditions and can filter out the emotional noise of retail investors.
-VWMA and an SMA (The bottom oscillator) gives an idea of the trend tacking into account of the volume, this serves as a more short term filter of the trend for filters.
-OBV checks are done between the OBV and an EMA of the OBV, to get the idea of a volume weighted long trend, which is important for crypto as there are massive rallies to go up due to retail greed, it’s great to jump onto it at the beginning, and get off before the stack of cards fall apart.
-ATR is used to detect when the market is relatively just ranging or moving sideways, which is where the hidden divergence entries are done, during predictable and profitable market conditions.
- Stop loss is based on the closest support of the entry, this is a nice medium of room to breath but also an actual stop loss.
Future plans and improvements:
Currently there’s a lot I want to improve, mostly the divergence detection and the overall sharpe ratio could be much better, but the current value of 0.5 gives me hope that the strategy is onto something. I also want to change TP from a percentage stop to something more dynamic but that might be too optimistic. The current plan is to paper trade test this either by manual or by a python bot, to see how it performs with some user input as well.

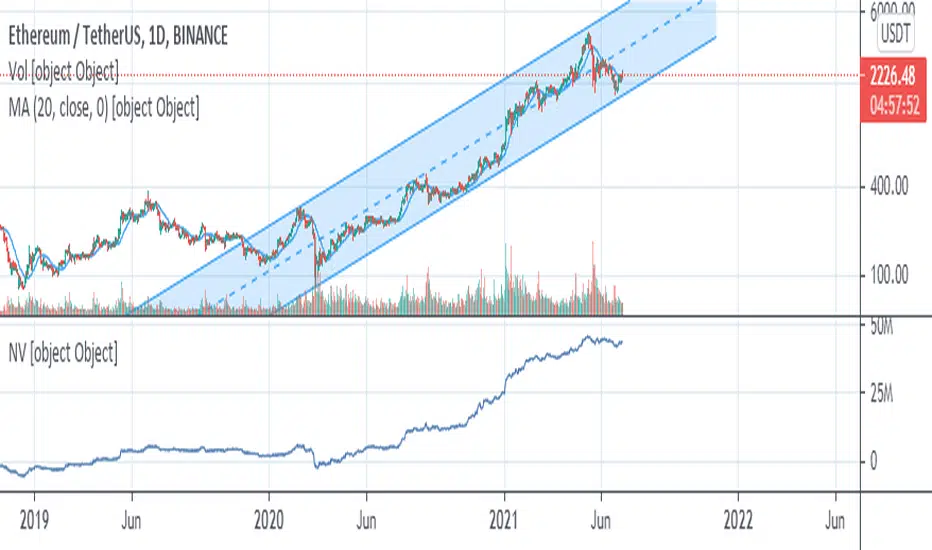
Net VolumeNet Volume, or NV in short, is a cumulative volume indicator similar to OBV and A/D. Though it might look similar to these two indicators (especially A/D), rest assured it's better and more accurate than both. What it basically does, is dividing the volume session into buyers and sellers volumes; then subtracts former from the latter and adds the result to previous session's net volume (In the script, these two intermediate volumes are not calculated and only the subtraction is formulated in an integrated form).
Another important difference between NV and A/D indicator, is that it brings price gaps into account. That's why it requires next session's open price to calculate current session's NV. What it actually mean is that the price gap, in either direction, is the result of the traders' efforts in respective direction in previous session, as if the current session closes where next session opens.
[ENG/PL] Sumiński's Volume | Wolumen SumińskiegoNASDAQ:DISCK ENG below.
Niniejszy wskaźnik, który jako jego twórca pozwoliłem sobie nazwać w tłumaczeniu na Polski - Wolumenem Sumińskiego :)
Od innych wskaźników wolumenu różni się tym, że mierzy "gęstość wolumenu" na danym barze. Polega to na tym, że w przypadku wystąpienia dużej świecy, np. spadkowej przy niewielkim wolumenie - oznacza to że wskazany obszar cenowy pozbawiony jest drugiej strony - w tym przypadku kupujących, nie zachodzi tu chęć odkupienia sprzedawanego instrumentu.
Jednak w przypadku wystąpienia niedużej świecy, a podwyższonego wolumenu - oznacza to, że przy danym poziomie ceny spotkał się duży kapitał kupujących i sprzedających - wskaźnik oznacza taki bar wysoką wartością. Im wyższy poziom wskaźnika tym "gęstsza" i mocniejsza wymiana pomiędzy kupującymi a sprzedającymi.
_____________________________________________
This indicator, which, as its creator, I have allowed myself to call - Sumiński's Volume :)
It differs from other volume indicators in that it measures the "volume density" on a given bar. It consists in the fact that in the event of a large candle, e.g. a downward candle with a small volume - it means that the indicated price area has no other side - in this case there are buyers, there is no desire to buy back the instrument being sold.
However, in the event of a small candle and an increased volume - this means that at a given price level, there was a large capital of buyers and sellers - the indicator means such a bar with a high value. The higher the index level, the "denser" and stronger the exchange between buyers and sellers.

Keltner + RSI Bitcoin Futures Trading [luca_badoer]This indicator combines the power of the Keltner channel with the power of the Relative Strength Indicator (RSI). It can help understand when the market is entering a bullish or a bearish trend.
Normally a Keltner channel would reference an Exponential Moving Average (EMA) of the price. In this case the Keltner Channel in the "Keltner + RSI Bitcoin Futures Trading " references the EMA of the 14-day RSI (white line). On top of that it overlays a 7-day RSI line (blue line). This produces some signals that are particularly useful in 2h, 4h and 1 day charts. The signals consist in the 7-day RSI line (blue line) crossing the upper (green) or lower (red) Keltner channels as well as the middle (white) line. Depending on the direction of the crossing (up or down) and the RSI level (from 0 to 100) at which the crossing takes place this produces bullish or bearish signals.
Examples:
- Bullish crossing: 7-day RSI (blue) crosses both the lower (red) and middle (white) lines upwards at a low to neutral RSI level (<70%)
- Bearish crossing: 7-day RSI (blue) cross both the upper (green) and middle (white) lines downwards at a high to neutral RSI (>30%)
Recommendations:
- Better to use it in 2h, 4h, and 1-day charts, thought it can also be used in lower timeframes. Confirmations of crossings in higher time-frames provide more certainty about the direction of the move.
- Use in combination with Heikin Ashi candles and volume indicators.

RSI Support & Resistance by DGTRSI Sᴜᴘᴘᴏʀᴛ & Rᴇꜱɪꜱᴛᴀɴᴄᴇ ʙʏ DGT
This experimental study attempts to translate Relative Strength Index (RSI) threshold levels of oversold/overbought and bull/bear zones as probable Price Support and Resistance levels
█ OPTIONS
Support & Resistance Levels , the main aim of the study. Level calculations are based on Relative Strength Index (RSI) threshold levels of oversold/overbought and bull/bear zones, where all threshold values are customizable through the user dialog box. Background of the levels can be colored optionally
RSI Weighted Colored Bars and/or Mark Overbought/Oversold Bars , Bar colors can be painted to better emphasis RSI values. Darker colors when the oscillator is in oversold/overbought zones, light colors when oscillator readings are below/above the bull/bear zone respectively, and remain unchanged otherwise. Besides the colors, with “Display RSI Overbought/Oversold Price Bars” option little triangle shapes can be plotted on top or bottom of the bars when RSI is in oversold/overbought zones
Example usage of the study with explanations
█ OTHERS
More regarding Support & Resistance concept (definition, identifying levels, trading S&R, etc) you are kindly invited to check my previous publication
Price Action - Support & Resistance by DGT
More regarding Relative Strength Index (RSI) and Relative Strength of Volume Indicators , please check Relative Strength of Volume Indicators by DGT
Disclaimer:
Trading success is all about following your trading strategy and the indicators should fit within your trading strategy, and not to be traded upon solely
The script is for informational and educational purposes only. Use of the script does not constitute professional and/or financial advice. You alone have the sole responsibility of evaluating the script output and risks associated with the use of the script. In exchange for using the script, you agree not to hold dgtrd TradingView user liable for any possible claim for damages arising from any decision you make based on use of the script
